
lbi_test implements the static locally best invariant (LBI) test of
Breitung & Diegel (2025) for a bubble that is known, or assumed, to span the
entire sample: LBI = (y_T - y_1) / (sigma_tilde * sqrt(T - 1)), where
sigma_tilde^2 is the sample variance of the first differences. The test
is robust to heteroskedasticity by construction, because the invariance property
of the statistic does not depend on the exact form of the innovation variance.
The null distribution is standard normal, so the test needs no bootstrap, no
simulation and no published table.
Arguments
- data
A univariate or multivariate numeric time series object, a numeric vector or matrix, or a data.frame. A column may have leading or trailing
NAvalues, which describes an unbalanced panel in which series enter or exit the sample at different times. Those periods are filled withNAinbadfandbsadfand excluded from theadf,sadfandgsadfof that series. InteriorNAvalues (a gap in the middle of a series) are not supported. When any series is padded in this way, the panel statistics (bsadf_panelandgsadf_panel) are not available, and the function returnsNAfor them with a warning.- sig_lvl
Significance level of the one-sided, right-tailed test (positive bubbles only), on the 0 to 100 scale used throughout the package (default
95). Any value in[50, 100)is accepted, because the critical value is a closed-form normal quantile.
Value
An object of class lbi_test_obj: a list with the test statistic
stat, the standard-normal critical value crit and detected
(logical, stat > crit).
Details
Only the static test, which uses a single full-sample window, is implemented. The main contribution of Breitung & Diegel is a sequential, exponentially weighted extension for monitoring a series when the start date is unknown. Its exact weighting scheme and boundary constant are not pinned down here, so this function does not implement it.
Note
The critical value is closed-form: it is the standard normal
(qnorm) quantile at sig_lvl, so no bootstrap, simulation or table
is needed.
The function returns its own class and not radf_obj, so it does not work
with summary(), \link{datestamp} and tidy. It has its own print() and
autoplot() methods instead.
print() shows the statistic, the critical value and whether the bubble was
detected. See vignette("naming-and-analysis", package = "exuber") for which
functions fit the shared pipeline and which do not.
![[Experimental]](figures/lifecycle-experimental.svg)
References
Breitung, J., & Diegel, M. (2025). A locally best invariant sequential test for explosive behavior in the presence of nonstationary volatility. Journal of Time Series Analysis.
See also
radf for the recursive ADF-family alternative that this
test complements.
Other alternative tests:
quantile_test()
Examples
# \donttest{
y <- sim_psy1(n = 60, te = 1, tf = 60, seed = 1) # explosive from the start
res <- lbi_test(y)
print(res)
#>
#> ── lbi_test (n = 60, sig_lvl = 95%) ────────────────────────────────────────────
#>
#> series stat crit detected
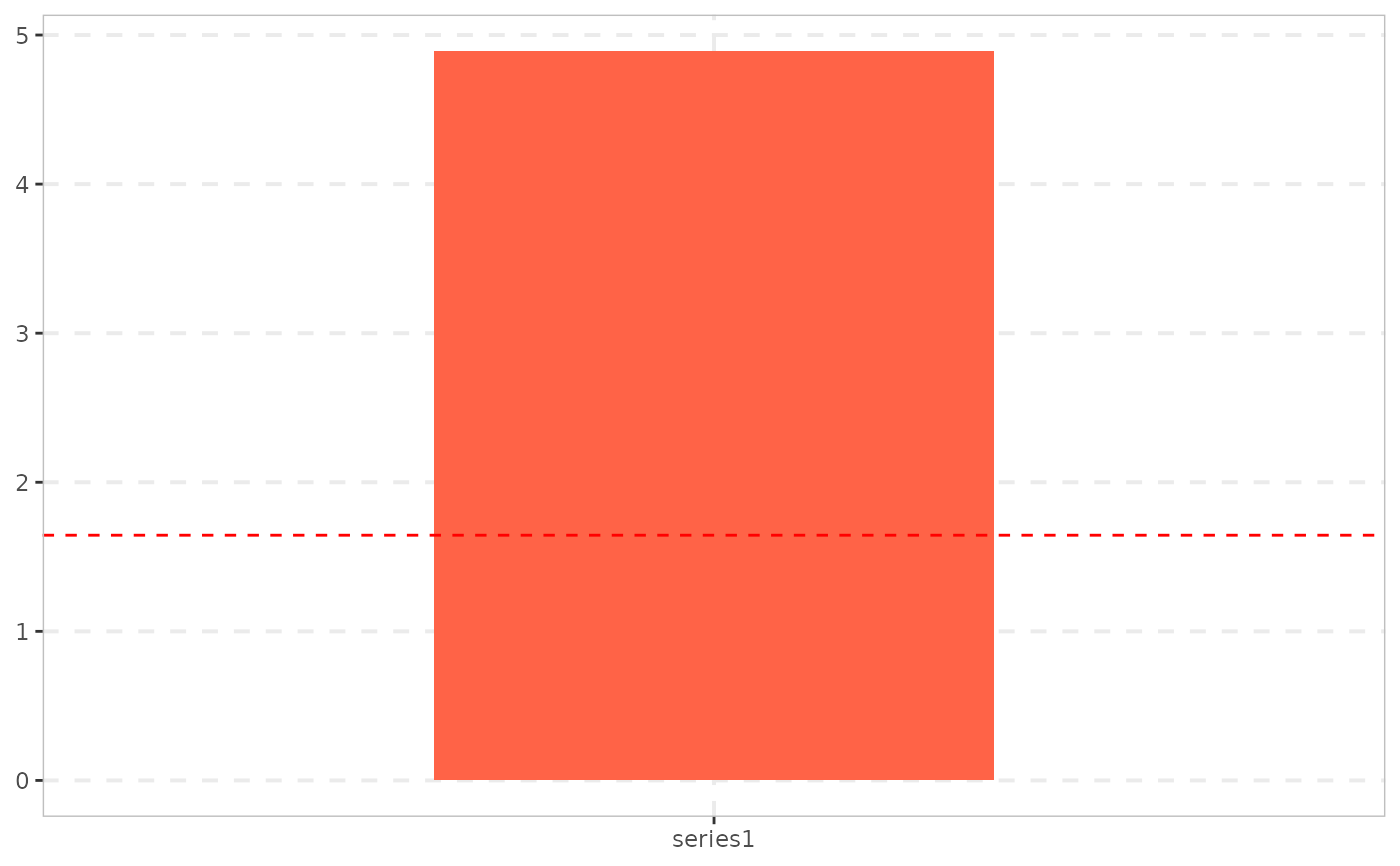
#> series1 4.892 1.645 TRUE
#>
# Compare the statistic to its critical value
autoplot(res)
 # }
# }