
Quantile Unit Root Test for Bubble Detection (Global Test)
Source:R/quantile_test.R
quantile_test.Rdquantile_test implements the "global test" of Wu, Shi & Wu (2025). It is
a quantile-regression (QR) analogue of the Dickey-Fuller t-ratio, and it tests
for explosive behavior at a chosen conditional quantile tau of y_t
given y_{t-1}, and not at the conditional mean. It is a single static
test and not a recursive scan. The comparable statistic in radf is
the single-shot adf statistic and not the recursive bsadf.
Usage
quantile_test(
  data,
  tau = "optimal",
  tau_grid = seq(0.2, 0.8, by = 0.05),
  nrep = 1000L,
  sig_lvl = 95,
  seed = NULL
)
Arguments
- data
A univariate or multivariate numeric time series object, a numeric vector or matrix, or a data.frame. A column may have leading or trailing
NAvalues, which describes an unbalanced panel in which series enter or exit the sample at different times. Those periods are filled withNAinbadfandbsadfand excluded from theadf,sadfandgsadfof that series. InteriorNAvalues (a gap in the middle of a series) are not supported. When any series is padded in this way, the panel statistics (bsadf_panelandgsadf_panel) are not available, and the function returnsNAfor them with a warning.- tau
Quantile to test at, in
(0, 1), or"optimal"(default) to select it with the grid search of eq. 33.- tau_grid
Grid searched when
tau = "optimal". The defaultseq(0.2, 0.8, by = 0.05)matches the practical range that the paper recommends, which excludes the extreme quantiles 0.1 and 0.9.- nrep
Number of Monte Carlo replications for the critical value.
- sig_lvl
Significance level, one of
90,95,99.- seed
Optional seed for the Monte Carlo draws.
Value
An object of class quantile_test_obj: a list with the test
statistic tstat, the selected tau, the estimated correlation
delta, the simulated crit value and detected (logical,
tstat > crit).
Details
tau = "optimal" (the default) selects the quantile that minimizes the
asymptotic variance of the QR estimator (their eq. 33) by grid search over
tau_grid. The grid excludes the extreme quantiles, which the paper itself
recommends avoiding at practical sample sizes.
The function simulates the critical value in each call and does not use a fixed
table. There is currently no reusable exported cv counterpart for this function.
This gap is tracked separately and is not addressed here. The limiting null
distribution of the statistic is sqrt(1 - delta^2) * z + delta * Q, where
z ~ N(0, 1), delta is a correlation coefficient estimated from the
data, and Q is the standard demeaned Dickey-Fuller t-statistic
distribution. The function simulates Q with the same random-walk-plus-OLS
t-statistic construction used elsewhere in this package (see
radf_mc_cv).
Note
The function returns its own class and not radf_obj, so it does not work
with summary(), \link{datestamp} and tidy. It has its own print() and
autoplot() methods instead. print() shows the statistic, the critical value and delta. See
vignette("naming-and-analysis", package = "exuber") for which functions fit
the shared pipeline and which do not.
![[Experimental]](figures/lifecycle-experimental.svg)
References
Wu, R., Shi, S., & Wu, J. (2025). Quantile analysis for financial bubble detection and surveillance. Journal of Time Series Analysis, 46(5), 908-931.
See also
radf for the family of tests based on mean regression
(ADF, SADF and GSADF) that this test complements.
Other alternative tests:
lbi_test()
Examples
# \donttest{
# Heavy-tailed (t3) innovations, where a quantile test is more useful than a test of the mean
y <- sim_psy1(n = 100, seed = 1, e = sim_innov(99, dist = "t", df = 3))
res <- quantile_test(y, nrep = 100, seed = 1)
print(res)
#>
#> ── quantile_test (n = 100, sig_lvl = 95%) ──────────────────────────────────────
#>
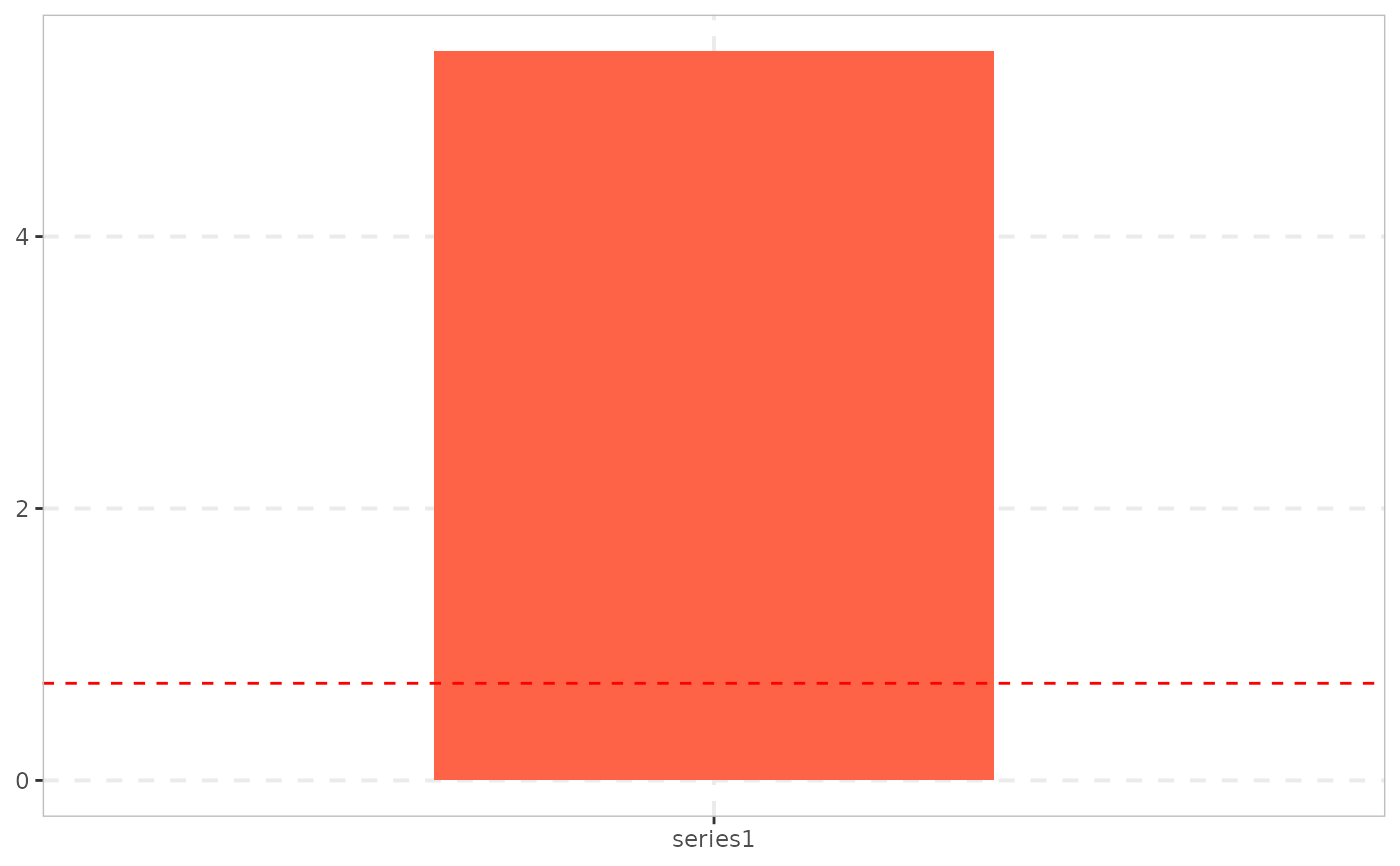
#> series tau tstat crit delta detected
#> series1 0.25 4.684 0.6824 0.379 TRUE
#>
autoplot(res)
 # Test at a fixed upper quantile instead of the optimal one
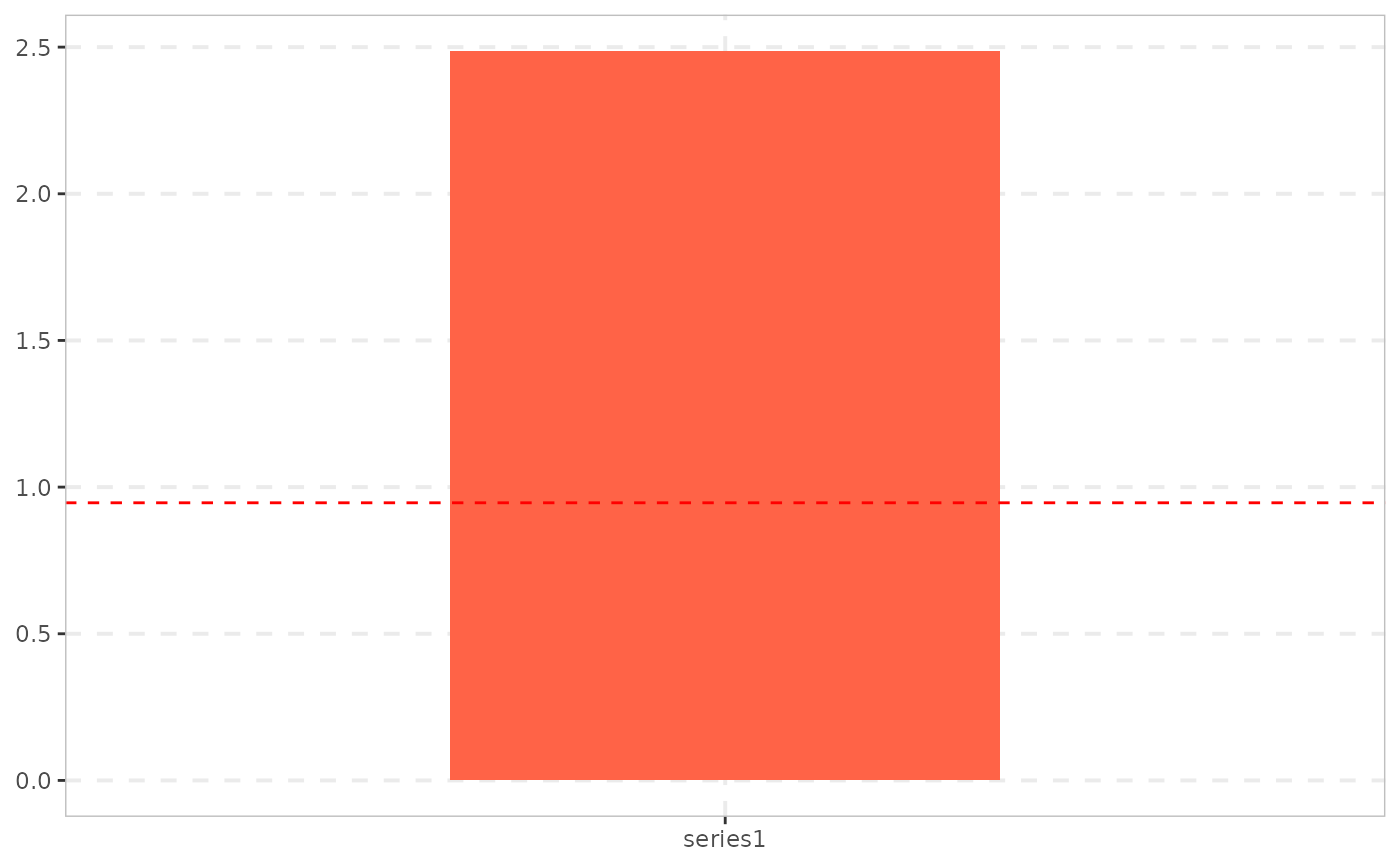
autoplot(quantile_test(y, tau = 0.9, nrep = 100, seed = 1))
# Test at a fixed upper quantile instead of the optimal one
autoplot(quantile_test(y, tau = 0.9, nrep = 100, seed = 1))
 # }
# }