Bernanke, Boivin, and Eliasz (2005)
Source:vignettes/replication-bbe2005.Rmd
replication-bbe2005.Rmdlibrary(econdata)
library(ggplot2)
library(dplyr)
#>
#> Attaching package: 'dplyr'
#> The following objects are masked from 'package:stats':
#>
#> filter, lag
#> The following objects are masked from 'package:base':
#>
#> intersect, setdiff, setequal, union
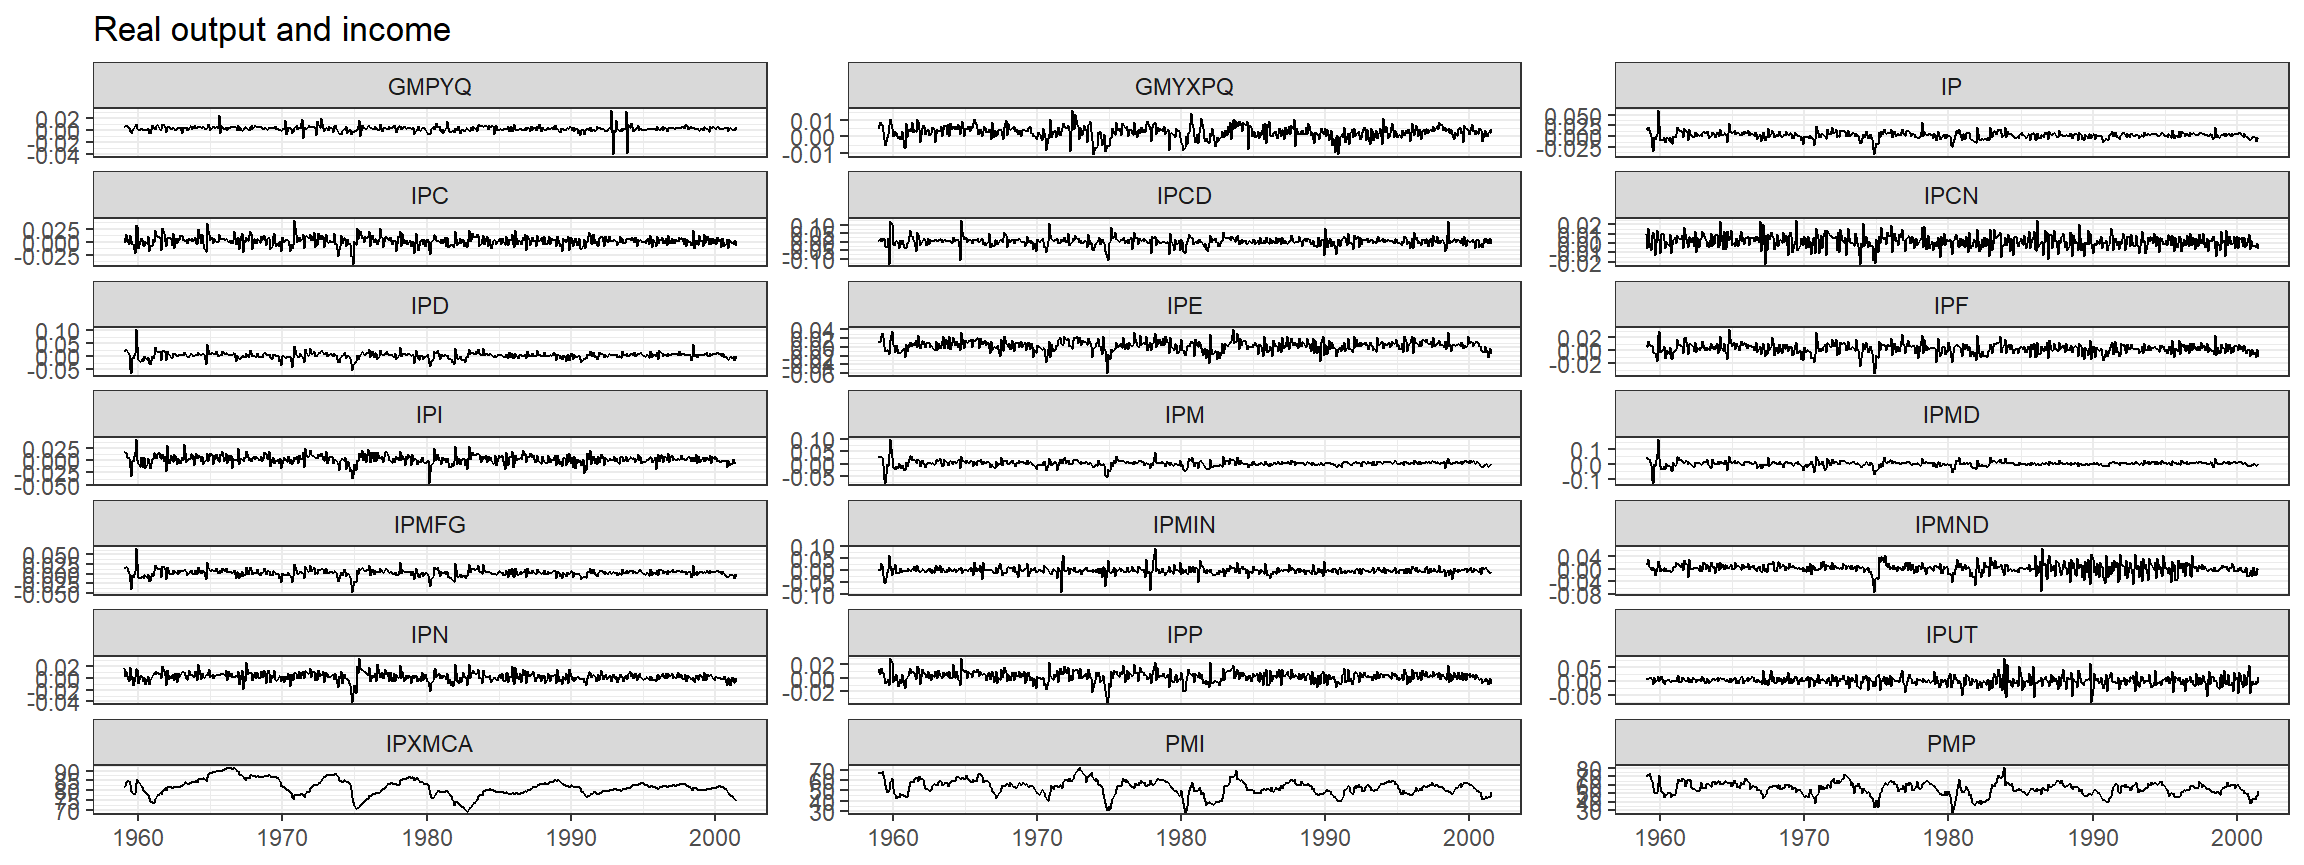
library(tidyr)bbe2005 %>%
select(Date, 2:22) %>%
gather(type, value, -Date) %>%
ggplot(aes(Date, value)) +
geom_line() +
facet_wrap(~type, ncol = 3, scales = "free_y") +
ggtitle("Real output and income") +
theme_bw() +
theme(
axis.title = element_blank()
)
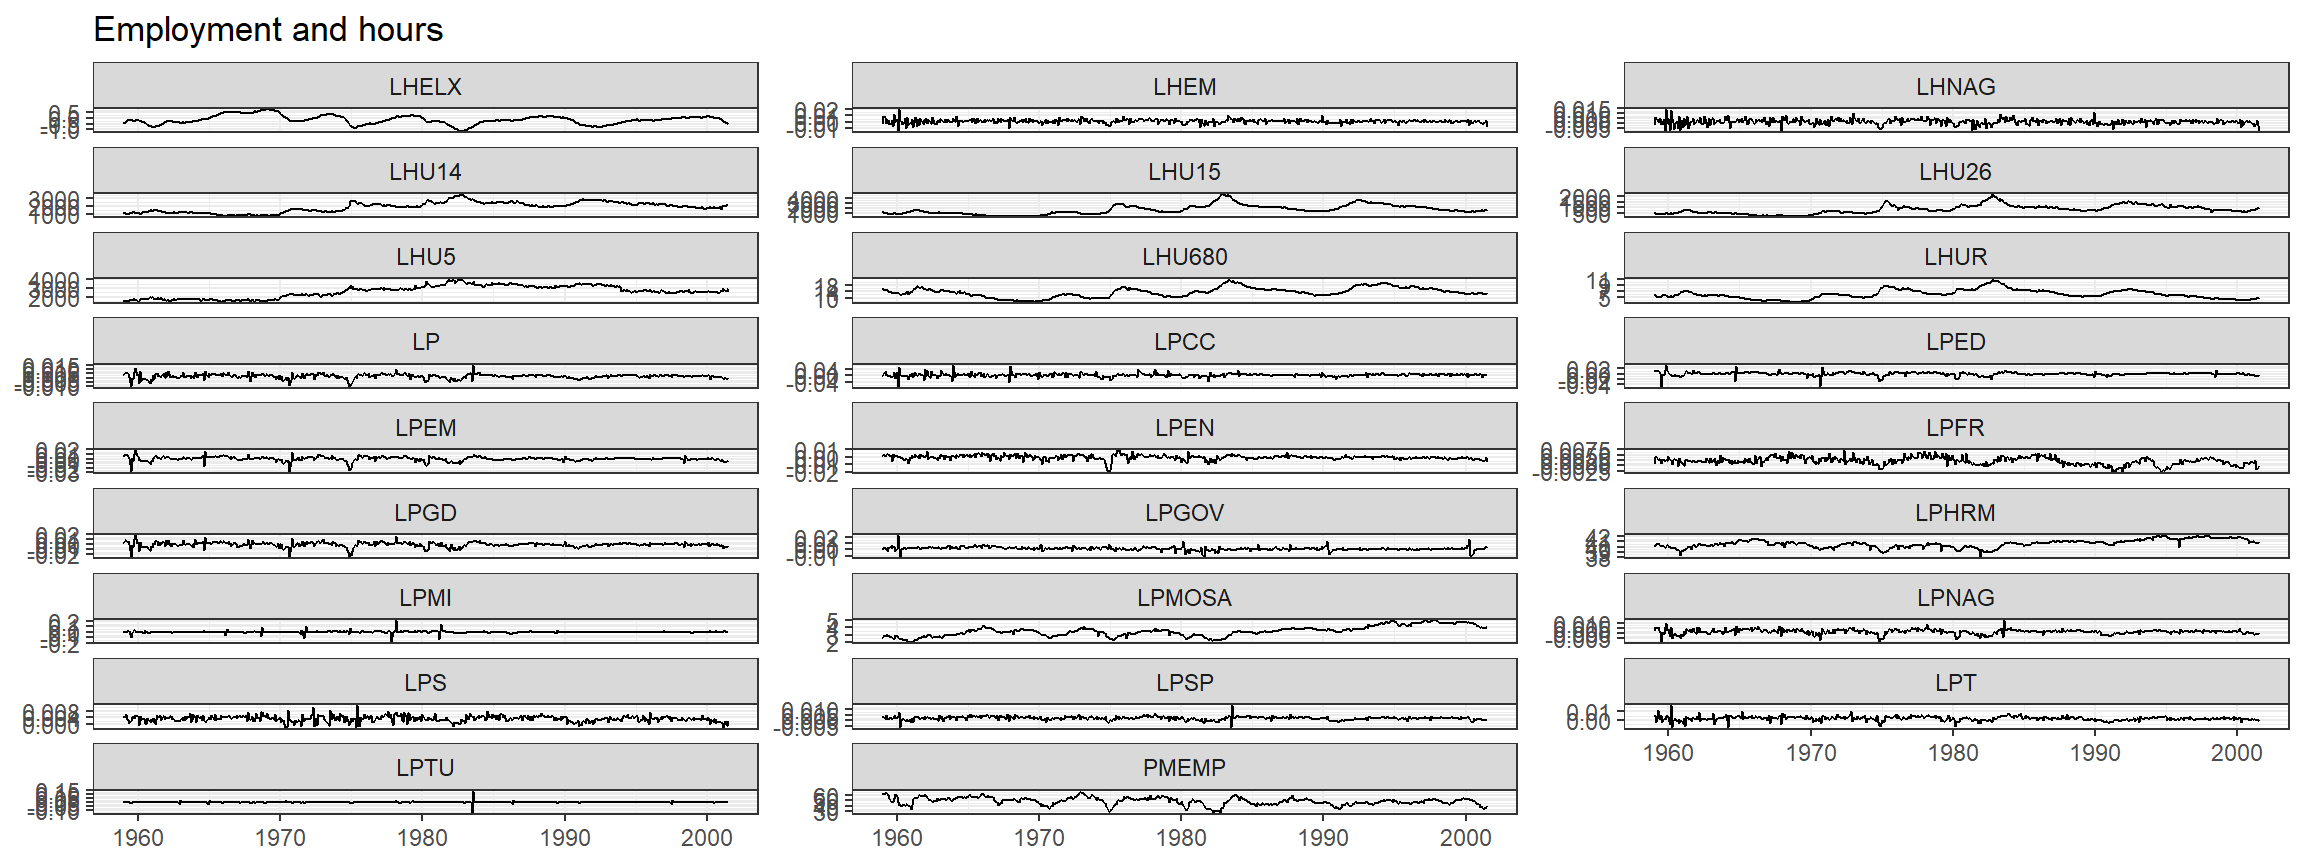
bbe2005 %>%
  select(Date, 24:49) %>%
  gather(type, value, -Date) %>%
  ggplot(aes(Date, value)) +
  geom_line() +
  facet_wrap(~type, ncol = 3, scales = "free_y") +
  ggtitle("Employment and hours") +
  theme_bw() +
    theme(
      axis.title = element_blank()
    )
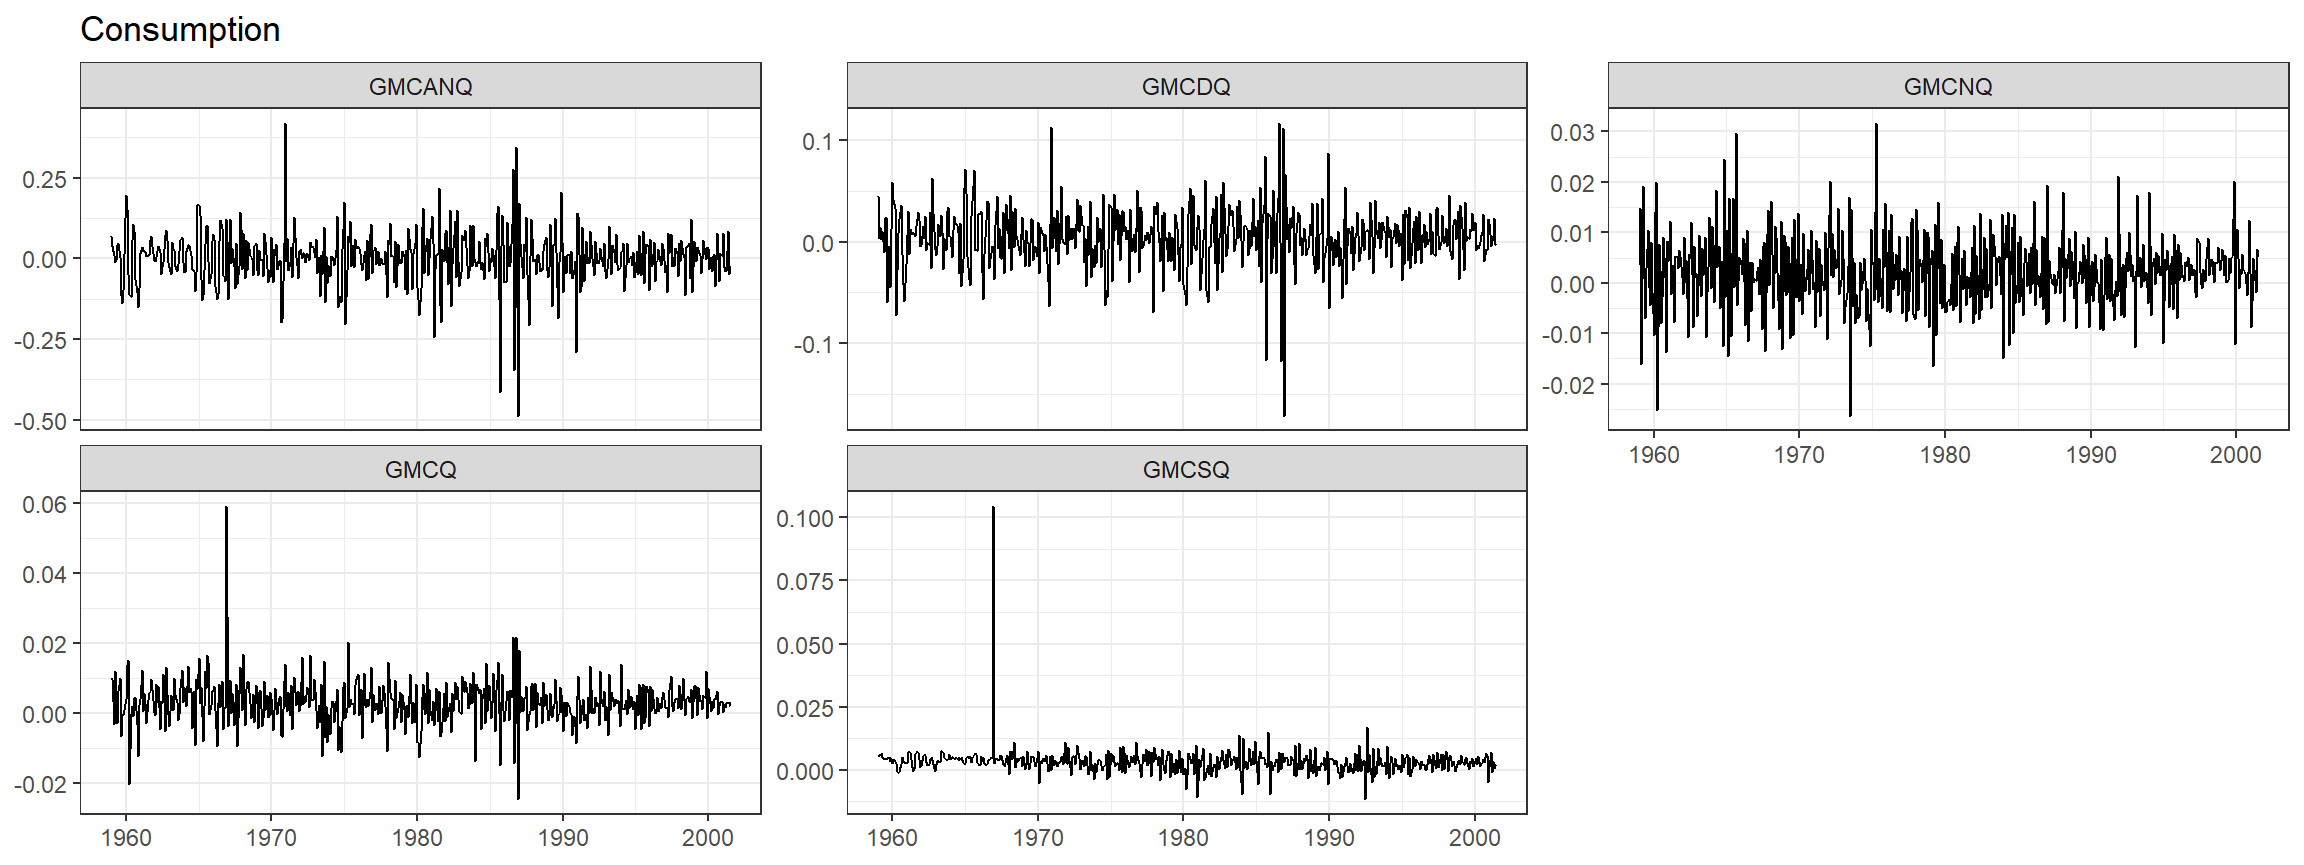
bbe2005 %>%
  select(Date, 50:54) %>%
  gather(type, value, -Date) %>%
  ggplot(aes(Date, value)) +
  geom_line() +
  facet_wrap(~type, ncol = 3, scales = "free_y") +
  ggtitle("Consumption") +
  theme_bw() +
  theme(
    axis.title = element_blank()
  )
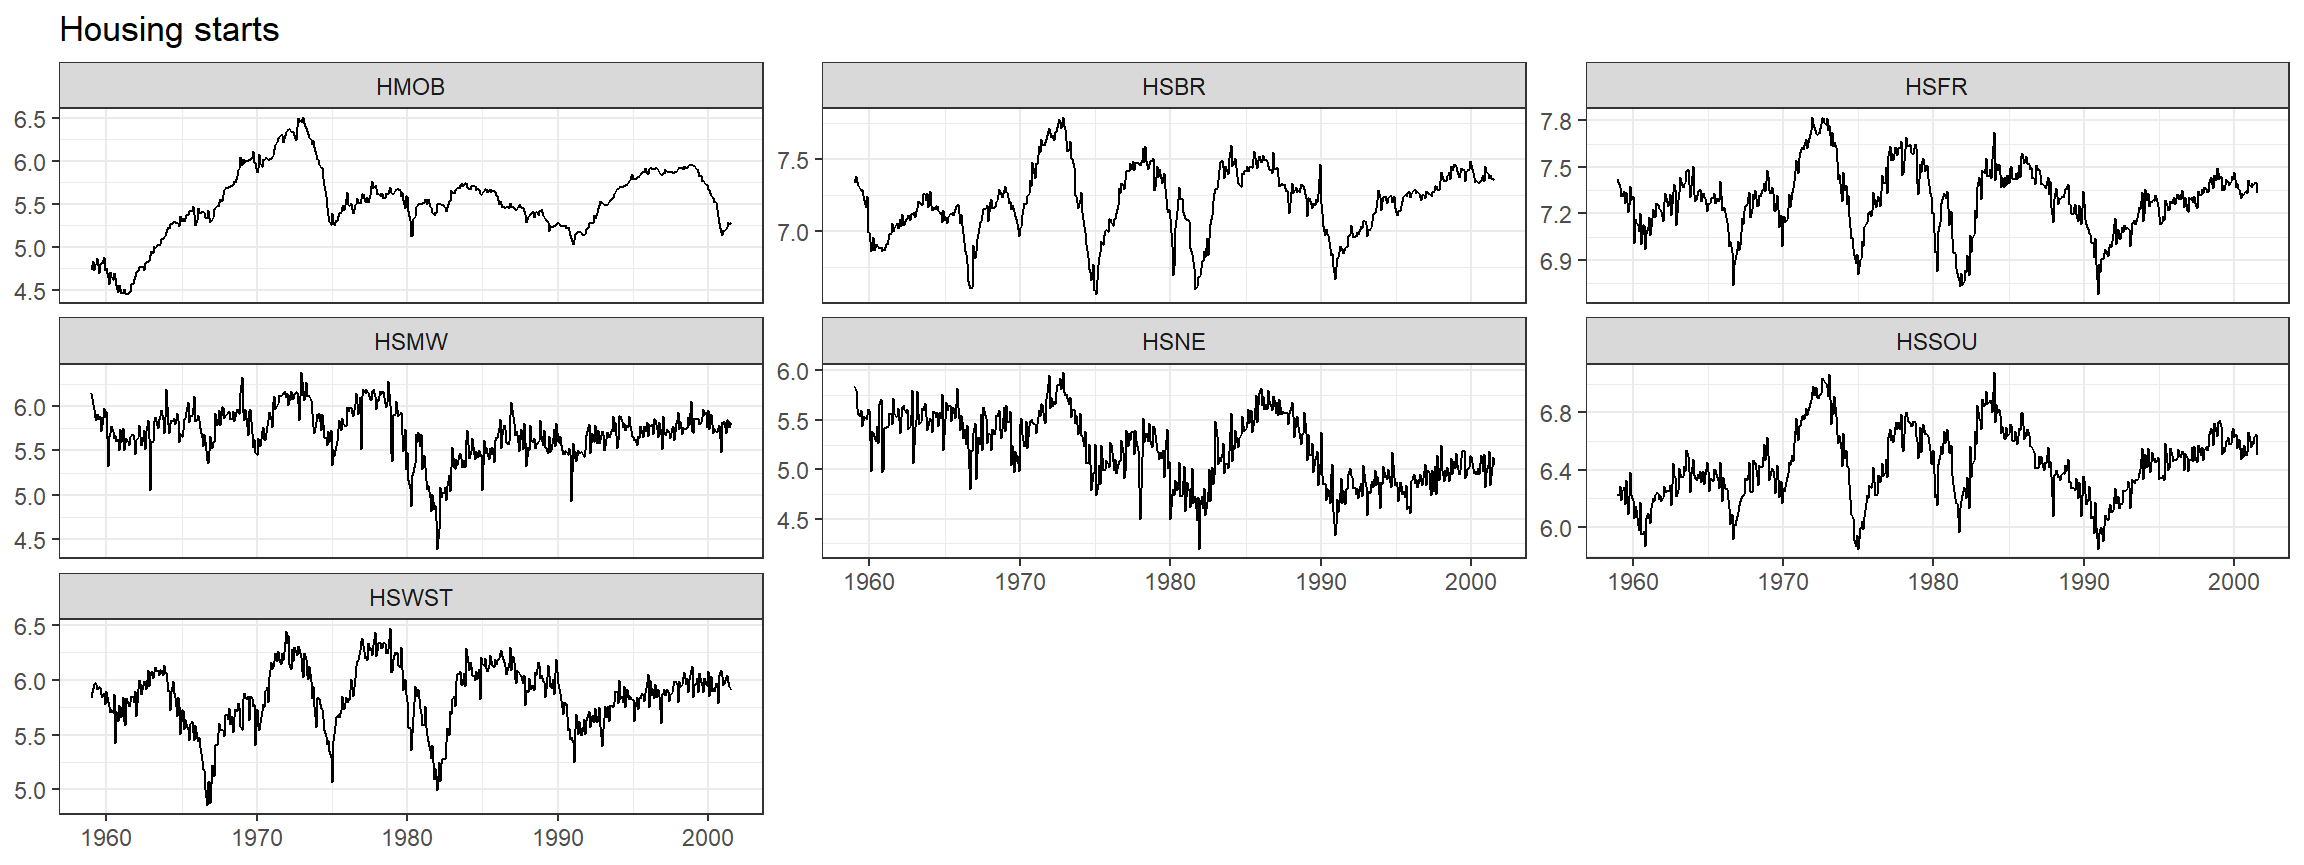
bbe2005 %>%
  select(Date, 55:61) %>%
  gather(type, value, -Date) %>%
  ggplot(aes(Date, value)) +
  geom_line() +
  facet_wrap(~type, ncol = 3, scales = "free_y") +
  ggtitle("Housing starts ") +
  theme_bw() +
  theme(
    axis.title = element_blank()
  )
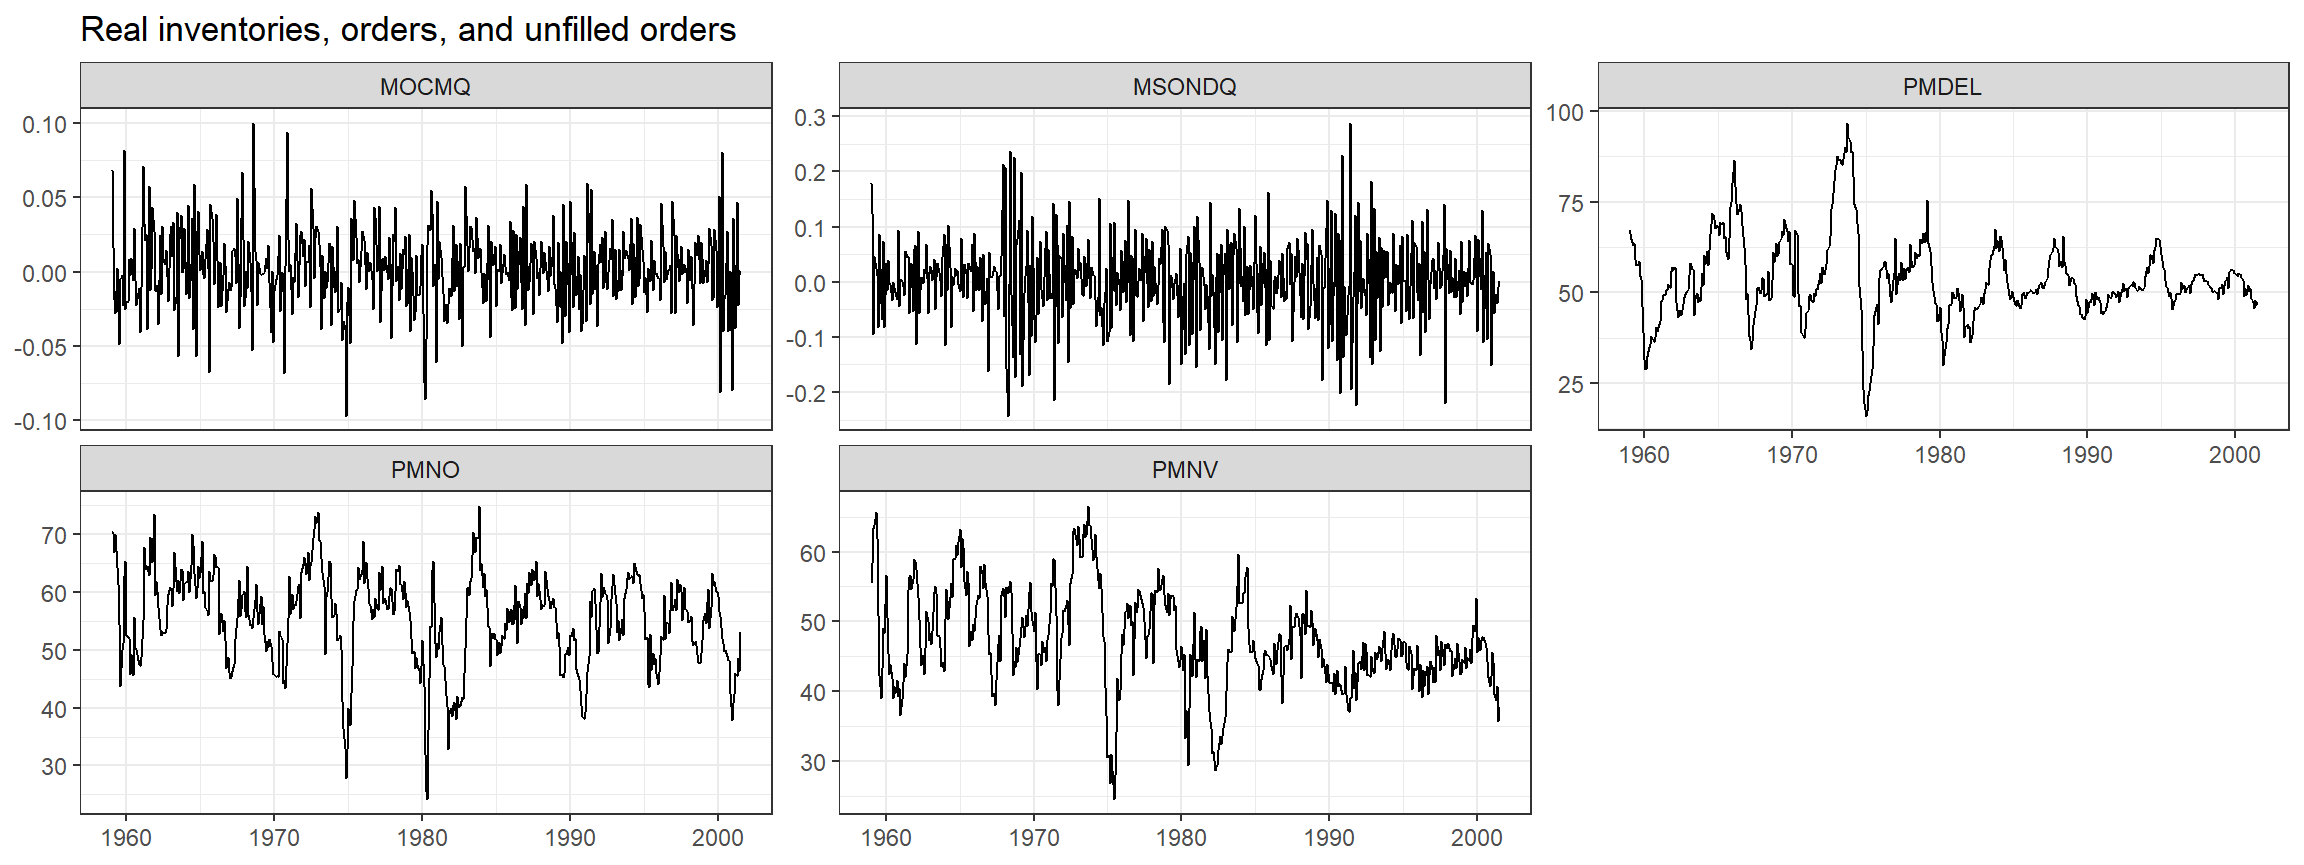
bbe2005 %>%
  select(Date, 62:66) %>%
  gather(type, value, -Date) %>%
  ggplot(aes(Date, value)) +
  geom_line() +
  facet_wrap(~type, ncol = 3, scales = "free_y") +
  ggtitle("Real inventories, orders, and unfilled orders") +
  theme_bw() +
  theme(
    axis.title = element_blank()
  )
bbe2005 %>%
  select(Date, 67:73) %>%
  gather(type, value, -Date) %>%
  ggplot(aes(Date, value)) +
  geom_line() +
  facet_wrap(~type, ncol = 3, scales = "free_y") +
  ggtitle("Stock prices") +
  theme_bw() +
  theme(
    axis.title = element_blank()
  )
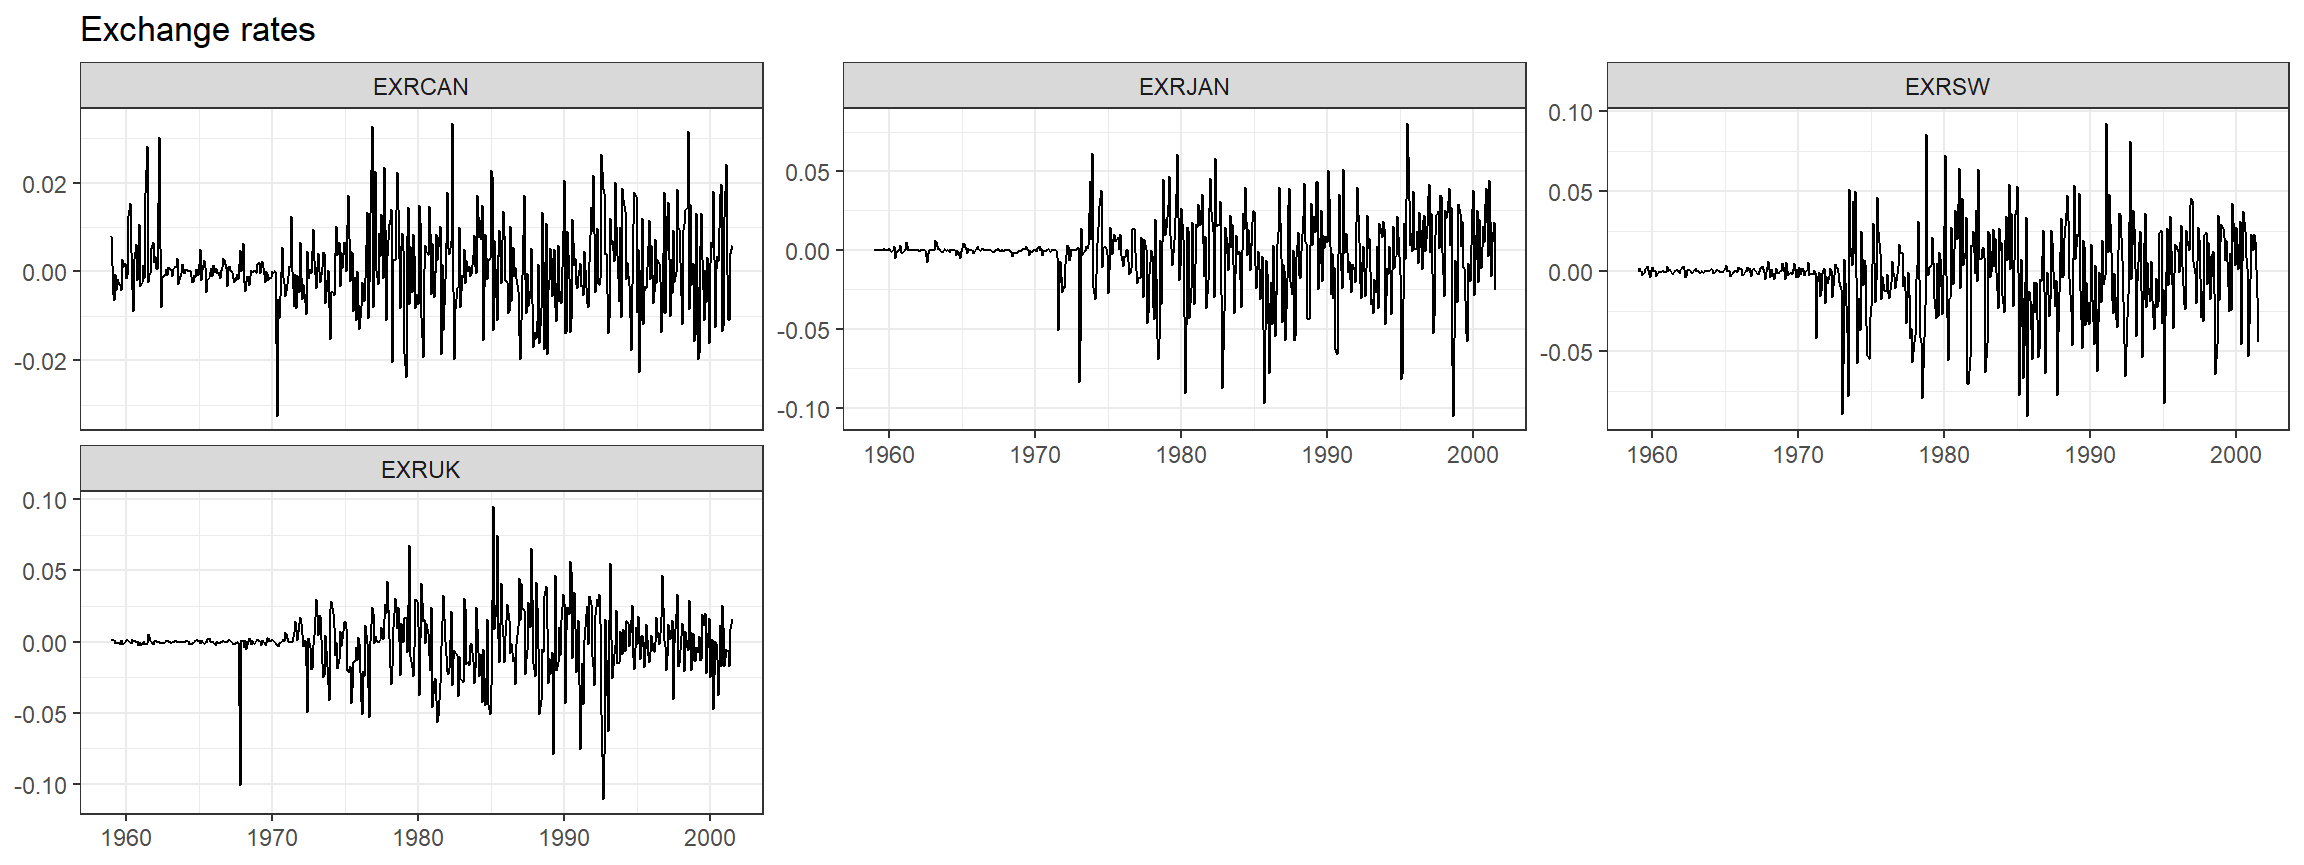
bbe2005 %>%
  select(Date, 74:77) %>%
  gather(type, value, -Date) %>%
  ggplot(aes(Date, value)) +
  geom_line() +
  facet_wrap(~type, ncol = 3, scales = "free_y") +
  ggtitle("Exchange rates") +
  theme_bw() +
  theme(
    axis.title = element_blank()
  )
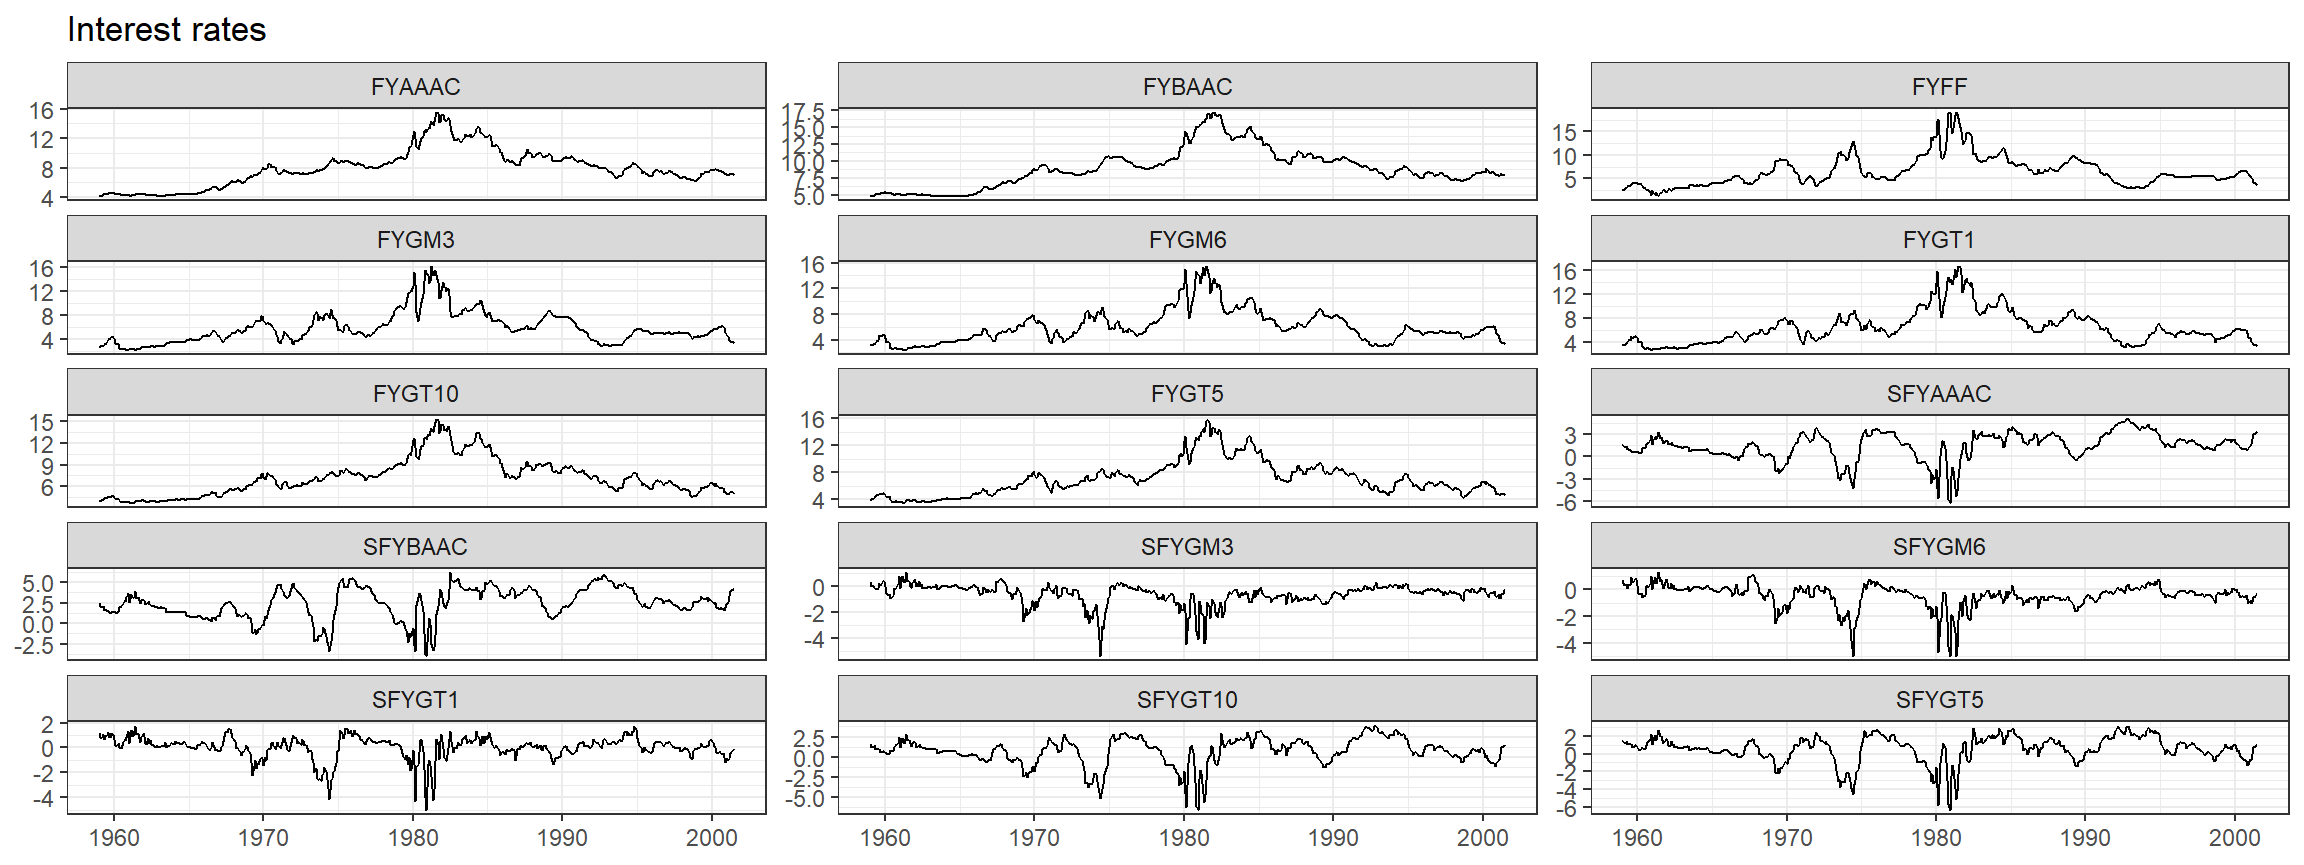
bbe2005 %>%
  select(Date, 78:92) %>%
  gather(type, value, -Date) %>%
  ggplot(aes(Date, value)) +
  geom_line() +
  facet_wrap(~type, ncol = 3, scales = "free_y") +
  ggtitle("Interest rates") +
  theme_bw() +
  theme(
    axis.title = element_blank()
  )
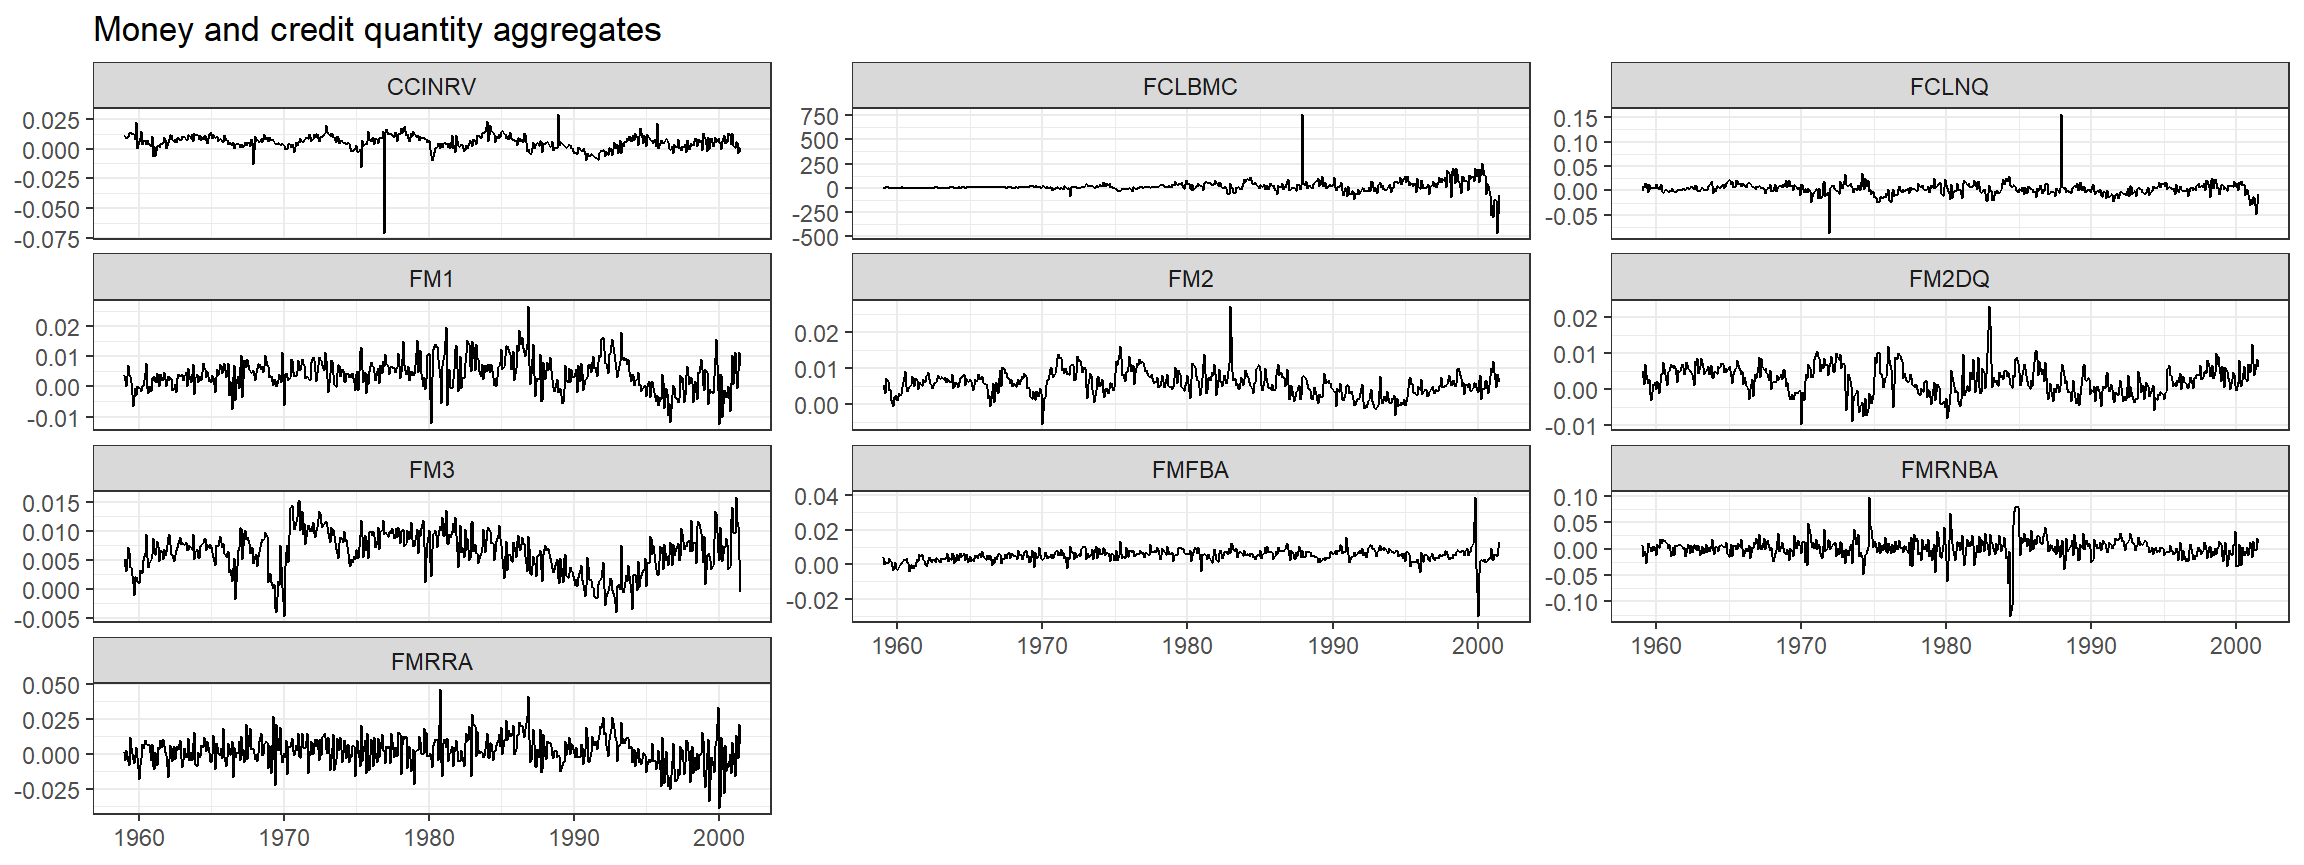
bbe2005 %>%
  select(Date, 93:102) %>%
  gather(type, value, -Date) %>%
  ggplot(aes(Date, value)) +
  geom_line() +
  facet_wrap(~type, ncol = 3, scales = "free_y") +
  ggtitle("Money and credit quantity aggregates") +
  theme_bw() +
  theme(
    axis.title = element_blank()
  )
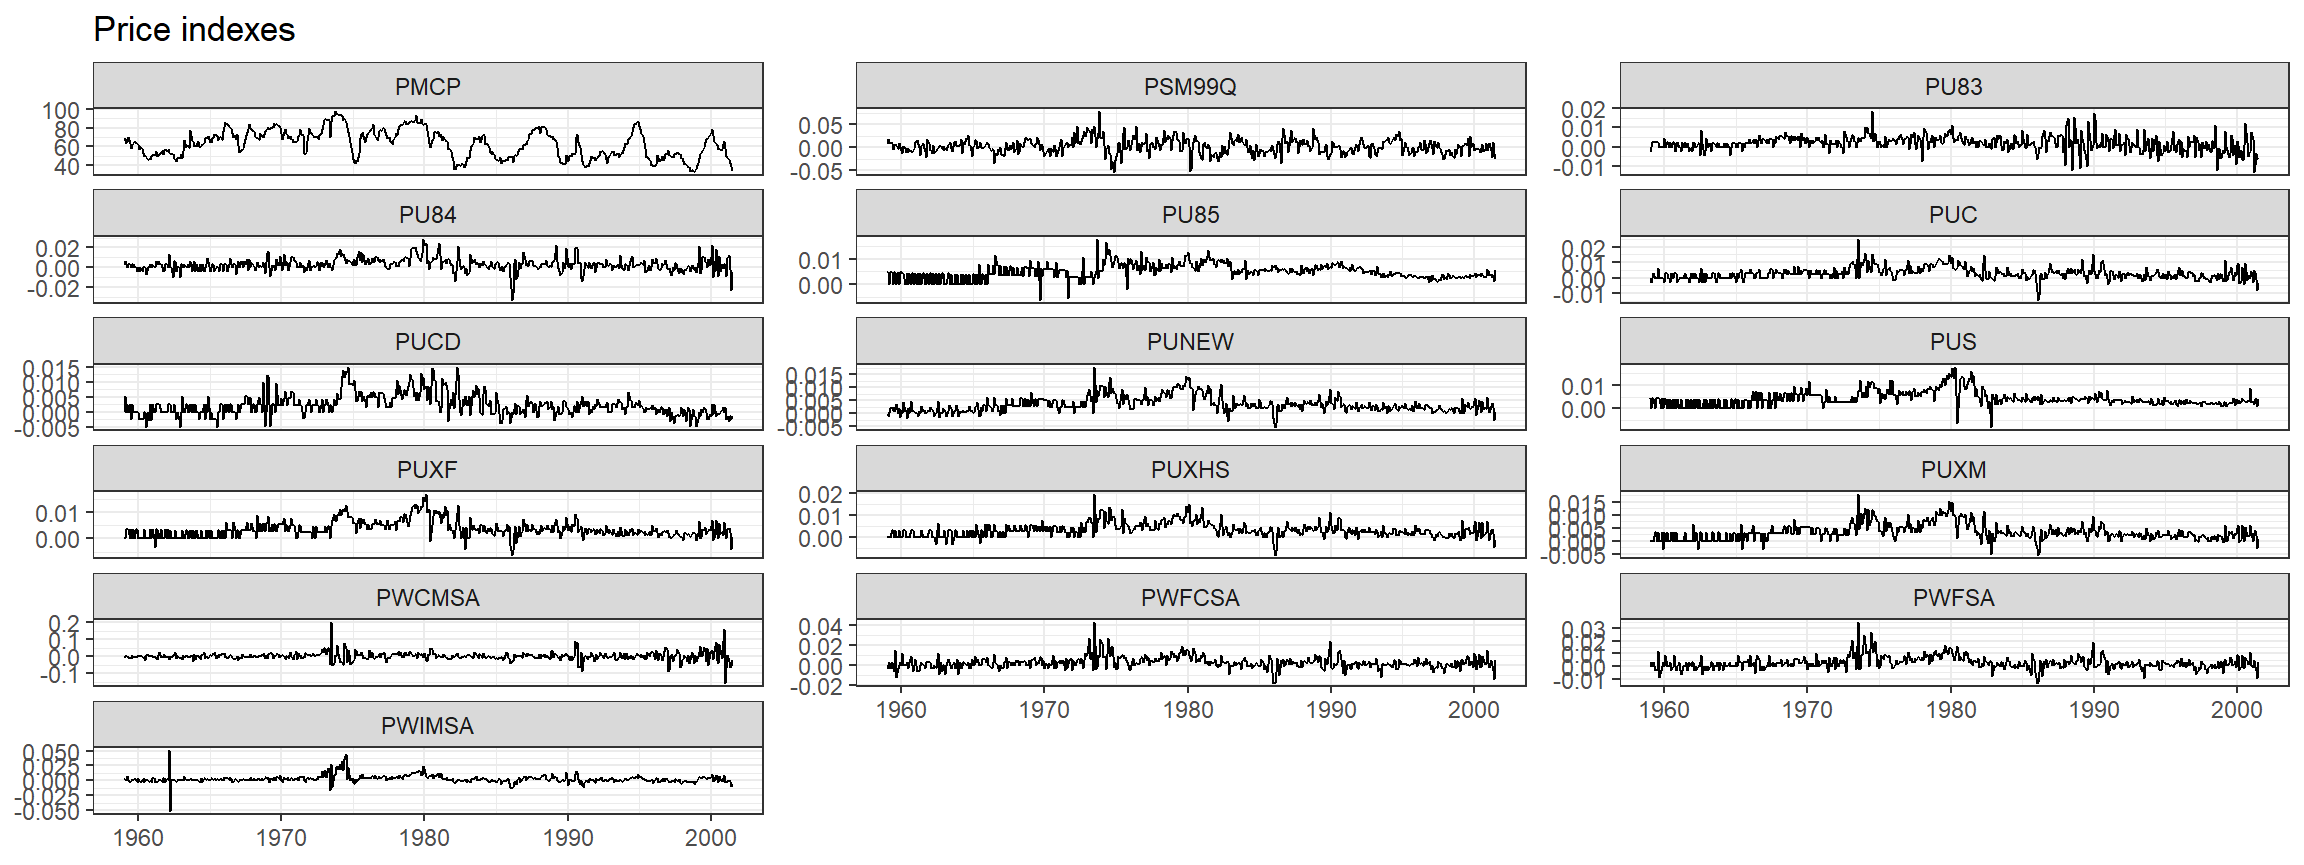
bbe2005 %>%
  select(Date, 103:118) %>%
  gather(type, value, -Date) %>%
  ggplot(aes(Date, value)) +
  geom_line() +
  facet_wrap(~type, ncol = 3, scales = "free_y") +
  ggtitle("Price indexes") +
  theme_bw() +
  theme(
    axis.title = element_blank()
  )
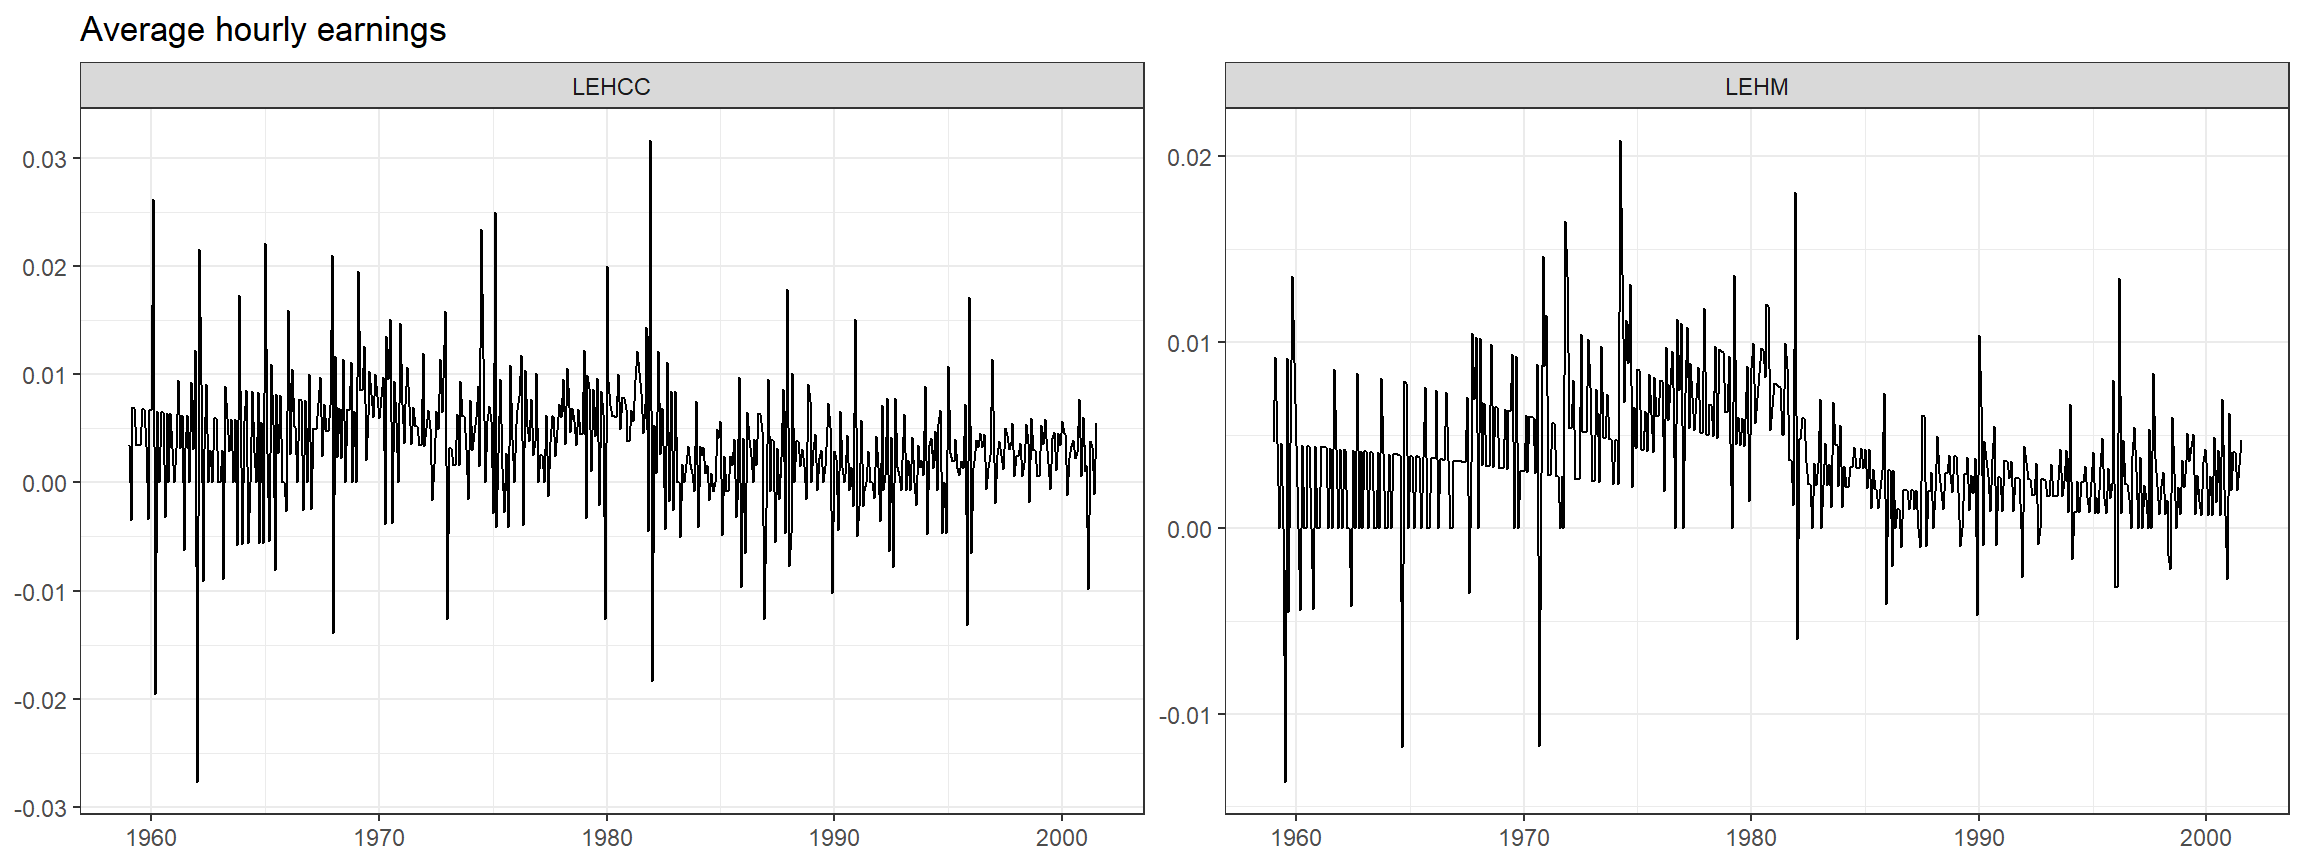
bbe2005 %>%
  select(Date, 119:120) %>%
  gather(type, value, -Date) %>%
  ggplot(aes(Date, value)) +
  geom_line() +
  facet_wrap(~type, ncol = 3, scales = "free_y") +
  ggtitle("Average hourly earnings ") +
  theme_bw() +
  theme(
    axis.title = element_blank()
  )
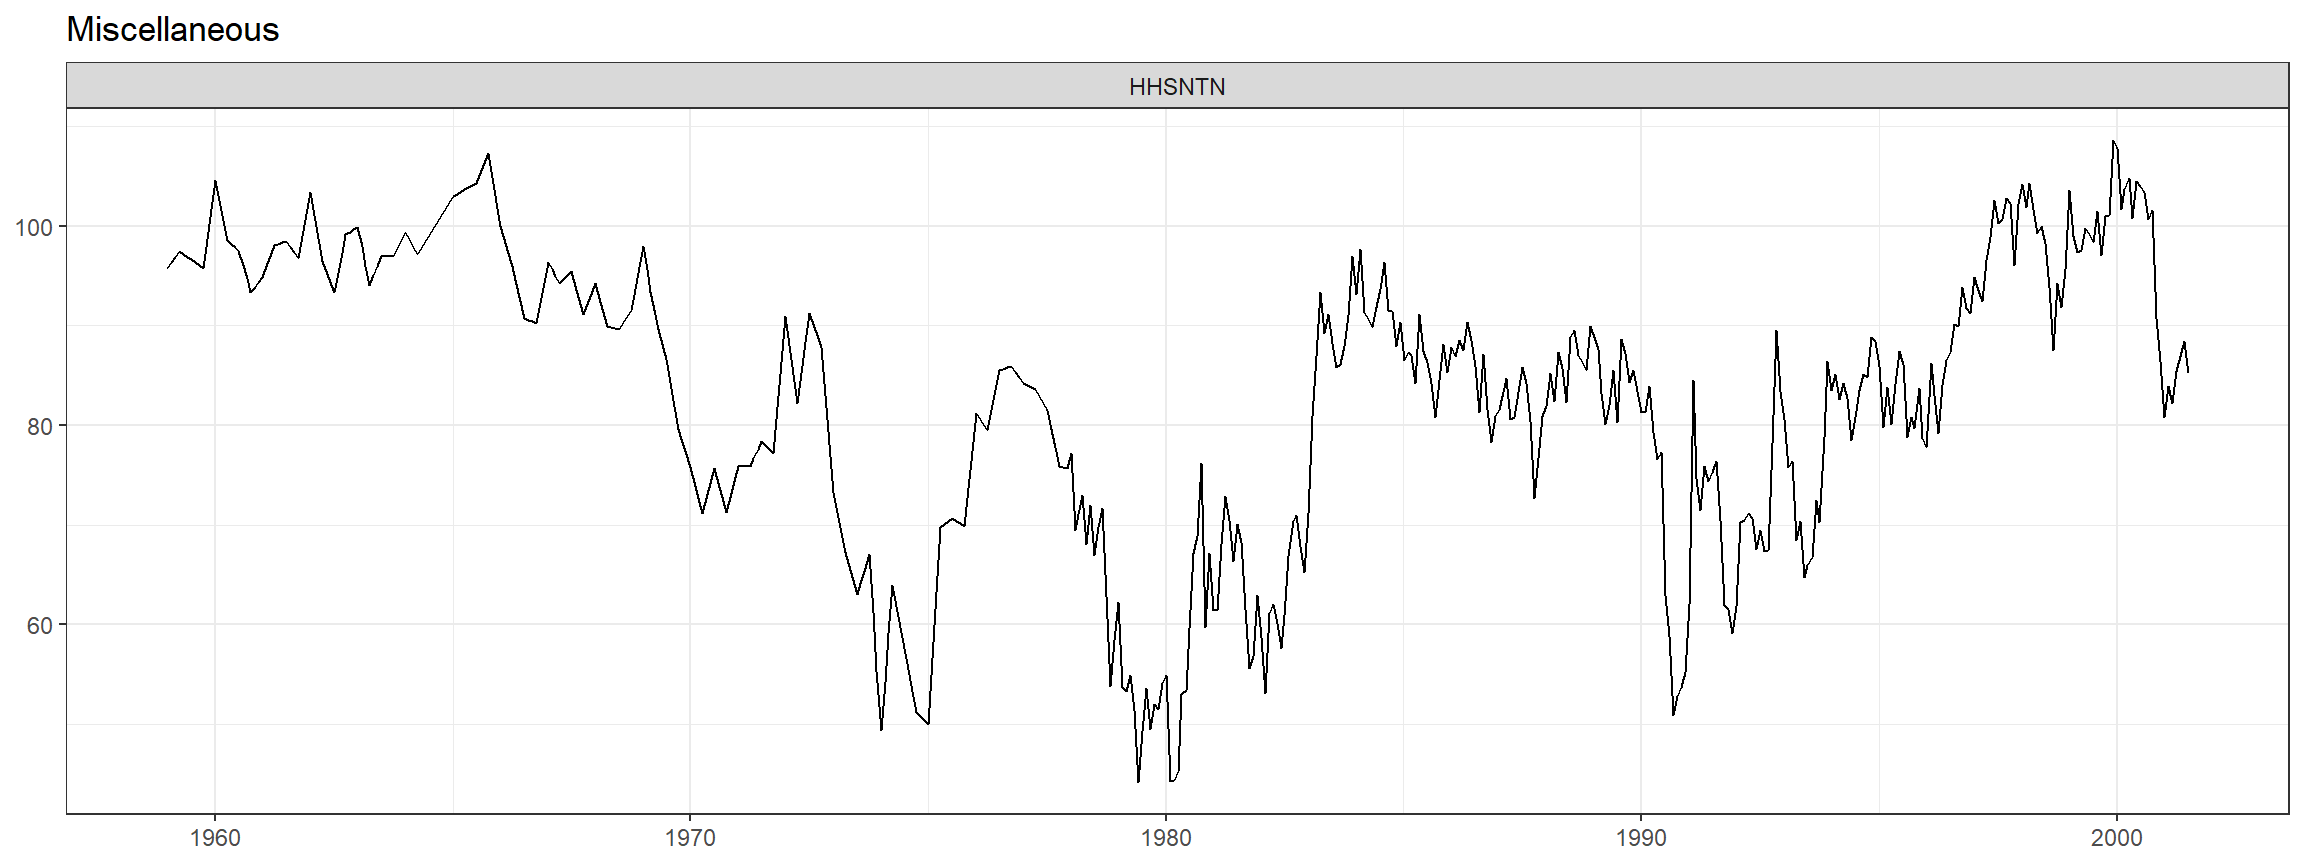
bbe2005 %>%
  select(Date, 121) %>%
  gather(type, value, -Date) %>%
  ggplot(aes(Date, value)) +
  geom_line() +
  facet_wrap(~type, ncol = 3, scales = "free_y") +
  ggtitle("Miscellaneous ") +
  theme_bw() +
  theme(
    axis.title = element_blank()
  )