filter_hamilton(x, p = 4, horizon = 8, fill = NA)
Arguments
| x |
Univariate vector, numeric or ts object with only one dimension. |
|---|---|
| p |
A value indicating the number of lags |
| horizon |
A value indicating the number of periods to look ahead. |
| fill |
Numeric value(s) or function used to fill observations. |
Value
Returns a vector with the same class and attributes as the input vector.
Examples
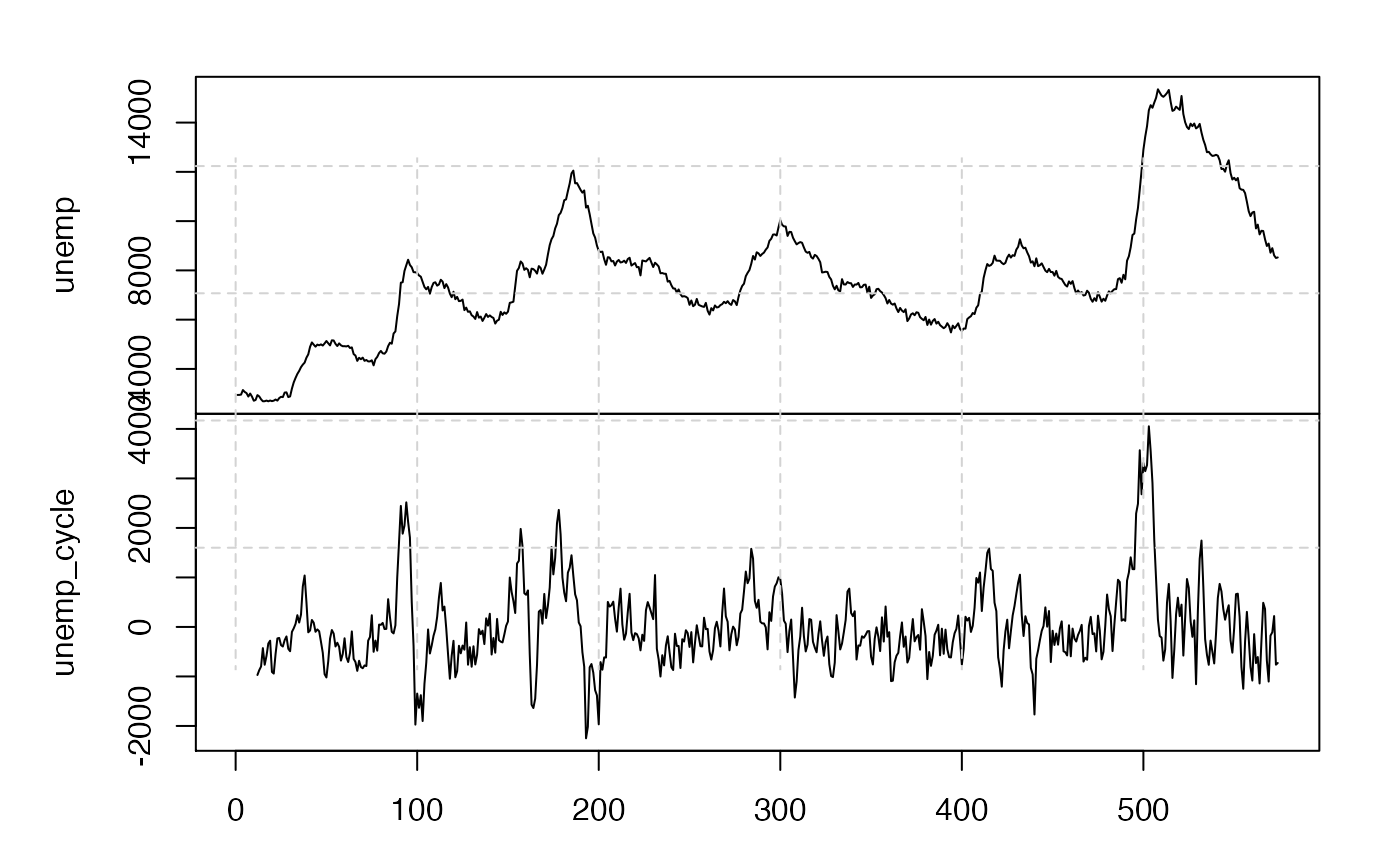
unemp <- ggplot2::economics$unemploy
unemp_cycle <- filter_hamilton(unemp)
plotx(cbind(unemp, unemp_cycle))
